Home
Top News
All Leagues
NFL
NBA
NHL
MLB
English Premier League
NCAA Football
NCAA Men's Basketball
PGA Tour
LPGA Tour
ATP
WTA
MMA
CFL
MLS
WNBA
NCAA Women's Basketball
NASCAR
Formula 1
Champions League
Europa League
Italian Serie A
German Bundesliga
French Ligue 1
Spanish La Liga
FIFA World Cup
Follow Us
X
Facebook
Instagram
Download the app
MATCHUP
RECAP
Baltimore Orioles @ Boston Red Sox on June 3, 2026
MASN
Orioles
29-33
1
Red Sox
26-34
8
Scoring
1
2
3
4
5
6
7
8
9
R
H
E
BAL
0
0
0
0
0
0
1
0
0
1
9
0
BOS
1
0
2
0
5
0
0
0
X
8
15
0
Scoring Summary
Bottom 1st
W. Abreu
Wilyer Abreu singles to left center field. Jarren Duran scores.
Bottom 3rd
W. Abreu
(7th HR)
Wilyer Abreu homers to right field. Caleb Durbin scores.
Bottom 5th
M. Gasper
(1st 3B)
Mickey Gasper triples to deep center field. Masataka Yoshida scores. Willson Contreras scores.
I. Kiner-Falefa
(3rd 2B)
Isiah Kiner-Falefa doubles to center field. Mickey Gasper scores.
C. Durbin
(13th 2B)
Caleb Durbin doubles to shallow left field. Isiah Kiner-Falefa scores.
C. Rafaela
Ceddanne Rafaela singles to shallow infield. Caleb Durbin scores.
Top 7th
A. Rutschman
(1st 3B)
Adley Rutschman triples to deep center field. Taylor Ward scores.
Game Details
Fenway Park
Boston
71°F
Clear
10 SSW
Wind mph
0%
Precipitation
Attendance
36,872
Umpires
HP - Blakney, 1B - Hudson, 2B - Mahrley, 3B - Gibson
Closing Odds
BOS -150, o/u 8.5
Game Time
2:49
Pitching
70
P T
Payton Tolle
(W, 3-2, 2.28)
6.0
IP
7
H
0
R
0
ER
5
K
2
BB
40
C B
Chris Bassitt
(L, 4-4, 5.27)
3.0
IP
6
H
3
R
3
ER
1
K
2
BB
56
R W
Ryan Watson
(S, 1)
3.0
IP
2
H
1
R
1
ER
2
K
2
BB
MASN
Orioles
29-33
1
Red Sox
26-34
8
Scoring
1
2
3
4
5
6
7
8
9
R
H
E
BAL
0
0
0
0
0
0
1
0
0
1
9
0
BOS
1
0
2
0
5
0
0
0
X
8
15
0
Pitching
70
P T
Payton Tolle
(W, 3-2, 2.28)
6.0
IP
7
H
0
R
0
ER
5
K
2
BB
40
C B
Chris Bassitt
(L, 4-4, 5.27)
3.0
IP
6
H
3
R
3
ER
1
K
2
BB
56
R W
Ryan Watson
(S, 1)
3.0
IP
2
H
1
R
1
ER
2
K
2
BB
Scoring Summary
Bottom 1st
W. Abreu
Wilyer Abreu singles to left center field. Jarren Duran scores.
Bottom 3rd
W. Abreu
(7th HR)
Wilyer Abreu homers to right field. Caleb Durbin scores.
Bottom 5th
M. Gasper
(1st 3B)
Mickey Gasper triples to deep center field. Masataka Yoshida scores. Willson Contreras scores.
I. Kiner-Falefa
(3rd 2B)
Isiah Kiner-Falefa doubles to center field. Mickey Gasper scores.
C. Durbin
(13th 2B)
Caleb Durbin doubles to shallow left field. Isiah Kiner-Falefa scores.
C. Rafaela
Ceddanne Rafaela singles to shallow infield. Caleb Durbin scores.
Top 7th
A. Rutschman
(1st 3B)
Adley Rutschman triples to deep center field. Taylor Ward scores.
Game Details
Fenway Park
Boston
71°F
Clear
10 SSW
Wind mph
0%
Precipitation
Attendance
36,872
Umpires
HP - Blakney, 1B - Hudson, 2B - Mahrley, 3B - Gibson
Closing Odds
BOS -150, o/u 8.5
Game Time
2:49
RELATED NEWS
Baltimore Orioles
@Orioles
How we're lining up for Game 1 in Toronto. 📻 98 Rock 97.9...
•
Red Sox
@RedSox
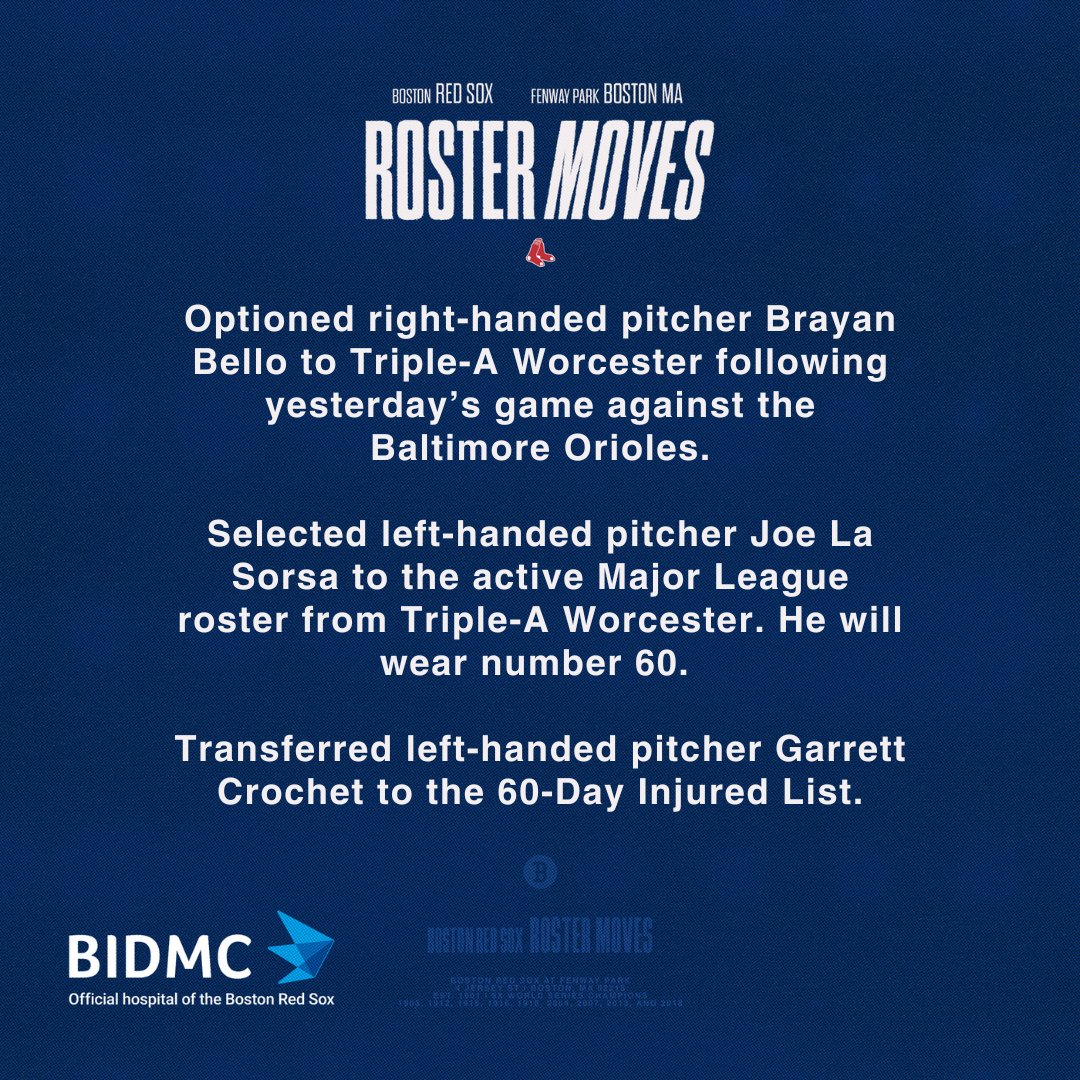
The #RedSox today announced the following roster moves:
•
Red Sox
@RedSox
Weekend in New York.
•
Baltimore Orioles
@Orioles
This is Mister Rogers' neighborhood.
•
Baltimore Orioles
@Orioles
Great team win! 👏
•
@Orioles on X
Baltimore Orioles
@Orioles
Laundry Day 🧦
•
Baltimore Orioles
@Orioles
Taylor plates another as the O’s bat around!
•
@Orioles on X
Baltimore Orioles
@Orioles
Baltimore chop makes it 2-0!
•
@Orioles on X
Baltimore Orioles
@Orioles
Adley gets us on the board!
•
@Orioles on X
Baltimore Orioles
@Orioles
We have made the following roster moves:
•
Red Sox
@RedSox
The #RedSox today announced the following roster moves:
•
Baltimore Orioles
@Orioles
Rubber match in Boston.
•
Red Sox
@RedSox
Series finale up next!
•
Red Sox shake off home struggles to blow out Orioles
•
Abreu has a two-run homer and 3 RBIs, Tolle pitches 6 scorel...
•
See More Stories
MLB
Scores
Scores
News
News
Standings
Standings